Category Archives: Uncategorized

Accessing the Genome Browser Programmatically Part 1 – How to get sequence from the UCSC Genome Browser

Note: We now have an API which can also perform many of these functions.

As the number of bioinformaticians have grown since the inception of the UCSC Genome Browser in 2000, there has been an increased need for programmatic access to the data and tools hosted at UCSC. Although there is no true API developed by UCSC (yet), there are a number of ways to interface with the UCSC Genome Browser, some more efficient than others. The intention of this blog post series is to explain some of the preferred ways to access the commonly requested Genome Browser data and tools and to add a bit of explanation of the architecture of the UCSC Genome Browser in general. The three most common requests are 1) how to download a single stretch of sequence in FASTA format, 2) how to download multiple ranges of sequence, and 3) how to get basic statistics on the nucleotides in a sequence. If you want the in-depth examples and explanation, skip down, but if you’re crunched for time, all you really need to know is the following three Q&As:

Q: How do I extract some sequence?
A: The best choice is to use the twoBitToFa command, available for your system here (Windows 10 users can use the linux.x86_64/ binaries in the Windows Subsystem for Linux). Here’s an example:

$ twoBitToFa http://hgdownload.soe.ucsc.edu/goldenPath/hg38/bigZips/hg38.2bit:chr1:100100-100200 stdout
>chr1:100100-100200
gcctagtacagactctccctgcagatgaaattatatgggatgctaaatta
taatgagaacaatgtttggtgagccaaaactacaacaagggaagctaatt

Q: What if I have a list of coordinates?
A: Again use twoBitToFa, this time with the -bed option (also check out the post on coordinate systems):

$ cat input.bed
chr1 4150100 4150200 seq1
chr1 4150300 4150400 seq2
$ twoBitToFa http://hgdownload.soe.ucsc.edu/goldenPath/mm10/bigZips/mm10.2bit -bed=input.bed stdout
>seq1
gcatcccagtcctgatactggaaaattcatttagtgacaagcgagggcca
cttgggattctctcacccccatatttaggagaccttattagggtcacctt
>seq2
tatccccttccctccccaccagatactacaattcacatcatactctgtcc
cccagtctacccataaaatctattctatttacctctccaaacgaagatct

Q: How do I count A, C, G, T?
A: twoBitToFa followed by faCount (available from the same location as twoBitToFa):

$ twoBitToFa http://hgdownload.soe.ucsc.edu/goldenPath/hg38/bigZips/hg38.2bit:chr1:100100-100200 stdout | faCount stdin
#seq    len     A       C       G       T       N       cpg
chr1:100100-100200      100     37      17      21      25      0       0
total   100     37      17      21      25      0       0

Run twoBitToFa or faCount with no arguments to get a usage message and view all of their options:

$ faCount
faCount - count base statistics and CpGs in FA files.
...


The most efficient way to get sequence from UCSC Genome Browser

The most common data request we receive is a request for FASTA sequence or sequences, making it a fitting subject for part 1 of this blog series about programmatic access to the Genome Browser. If you are browsing a region in the genome browser and you want to get a FASTA sequence for just the region you are browsing, using the keyboard shortcut ‘vd’ (v then d for view DNA) is probably the easiest way. But what about when you want to get sequences for a list of regions? What about if you need your web application to download the sequence? You could download sequence interactively with the Table Browser, although the solution is somewhat cumbersome: first you must make a custom track of the region(s) you would like sequence for, and then use the “output format: sequence” option with your custom track selected as the primary track. Fortunately, there is a much easier approach – downloading the 2bit file for your organism of interest and then using the twoBitToFa command on it like so:

$ wget http://hgdownload.soe.ucsc.edu/goldenPath/hg38/bigZips/hg38.2bit
$ twoBitToFa hg38.2bit:chr1:100100-100200 stdout
>chr1:100100-100200
gcctagtacagactctccctgcagatgaaattatatgggatgctaaatta
taatgagaacaatgtttggtgagccaaaactacaacaagggaagctaatt

The twoBitToFa command is available from the list of public utilities, in the directory appropriate to your operating system. twoBitToFa even accepts a URL to our downloads server as the 2bit argument, so if you wanted to grab some mm10 sequence, or even a list of sequences, you can just query the downloads server directly like so:

$ cat input.bed
chr1 4150100 4150200 seq1
chr1 4150300 4150400 seq2
$ twoBitToFa http://hgdownload.soe.ucsc.edu/goldenPath/mm10/bigZips/mm10.2bit -bed=input.bed stdout
>seq1
gcatcccagtcctgatactggaaaattcatttagtgacaagcgagggcca
cttgggattctctcacccccatatttaggagaccttattagggtcacctt
>seq2
tatccccttccctccccaccagatactacaattcacatcatactctgtcc
cccagtctacccataaaatctattctatttacctctccaaacgaagatct

Note that “stdout” in the above commands is a special option (along with the corresponding “stdin”) that tells the majority of UCSC commands to read/write from/to /dev/stdin and /dev/stdout instead of the required filenames, and is exemplified by the following common usage of generating some quick statistics on a region like chr1:100100-100200:

$ twoBitToFa http://hgdownload.soe.ucsc.edu/goldenPath/hg38/bigZips/hg38.2bit:chr1:100100-100200 stdout | faCount stdin
#seq    len     A       C       G       T       N       cpg
chr1:100100-100200      100     37      17      21      25      0       0
total   100     37      17      21      25      0       0

The twoBitToFa and URL to hgdownload 2bit combo is important because our downloads server is significantly more robust than our DAS CGI, can support more requests, and won’t slow the main site down for other users. We’ve also noticed that our DAS server often receives many requests for the same sequence, so for those of you providing software where the same query will be made multiple times, consider whether it would be more efficient to download an entire 2bit file to your local disk, rather than send the same query thousands of times to our servers.

Summary
twoBitToFa and faCount are two useful utilities, among the many other hundreds of tools available, that are useful for extracting sequence data. While not as preferable to working with locally downloaded files, twoBitToFa can also work with URLs to 2bit files, such as those on the UCSC Genome Browser download site. Stay tuned for part 2 of this programmatic access series — Using the Genome Browser public MySQL server and gbdb.


If after reading this blog post you have any public questions, please email genome@soe.ucsc.edu. All messages sent to that address are archived on a publicly accessible forum. If your question includes sensitive data, you may send it instead to genome-www@soe.ucsc.edu.

Annotating millions of private variants with vai.pl

For almost 4 years, Genome Browser users have been able to use the Variant Annotation Integrator (VAI) to predict the functional effects of their variants of interest. The VAI takes a variety of inputs (pgSnp/VCF custom track or hub, dbSNP rsID, HGVS terms) and annotates all the variants with their functional effect in Sequence Ontology terms (e.g. synonymous_variant, missense_variant, frameshift_variant, etc). The VAI returns predictions in Variant Effect Predictor (VEP) format, which is described here.

The VAI is quite flexible, and offers the option to choose any gene set or gene prediction track in the chosen genome database for functional annotation. All human genome databases include UCSC Genes (based on GENCODE V24 in GRCh38/hg38), RefSeq Genes, GENCODE/Ensembl genes as well as gene predictions produced by tools such as Augustus. Gene/transcript annotations used as the basis for functional effect prediction should be chosen carefully since they have a large effect on results (McCarthy et al.). For the GRCh37/hg19 and GRCh38/hg38 assemblies in particular, regulatory regions from ENCODE summary datasets can be used to identify variants that may have a regulatory effect, and disease or pathogenicity information from the Database of Non-Synonymous Functional Predictions (dbNSFP) can help distinguish between protein changes that are likely to be very disruptive to function, versus those that are likely to have little functional effect. Conservation scores may also be added to the output.

To reduce the volume of output and narrow in on the variants that are most likely to damage genes, filters can be added to restrict the output to specific functional effects (such as missense, frameshift, etc.) and/or variants overlapping conserved elements predicted from multi-species alignments.

Unfortunately, as a web tool the VAI does have some limitations, namely that only 100,000 variants at a time can be annotated, which prevents annotating variants derived from whole genome sequencing experiments. Also, for clinical users, privacy restrictions may prevent the uploading of a patient’s variant data to the UCSC Genome Browser.

Now our new vai.pl program provides a way around these restrictions. This program is intended to be run on a Genome Browser in a box (GBiB) or server hosting a mirror of the Genome Browser. vai.pl forms an interface to the VAI program running on your GBiB or mirror (so private data stays local), and is able to bypass the variant limit imposed by the web-based VAI. The script has many of the same configuration options as the web-based VAI, including filtering via functional effect term, position filters, and dbSNP rsID annotation. The script even includes a “–dry-run” option, so power users can further configure the VAI to better suit their needs.

Example Usage

For example, say you have a VCF file with a couple thousand variants and you want to check to see if there are any dbSNP rs IDs associated with your variants. Use the --rsId option:

$ vai.pl hg19 --rsId gatkUG.vcf.gz

## ENSEMBL VARIANT EFFECT PREDICTOR format (UCSC Variant Annotation Integrator)
## Output produced at 2017-05-05 13:40:35
## Connected to UCSC database hg19
## Variants: from file or URL (/hive/users/chmalee/hgVaiScriptTesting/gatkUG.vcf.gz)
## Transcripts: RefSeq Genes (hg19.refGene)
## dbSNP: Simple Nucleotide Polymorphisms (dbSNP 149) (/gbdb/hg19/vai/snp149.bed4.bb)
Uploaded Variation Location Allele Gene Feature Feature type Consequence Position in cDNA Position in CDS Position in protein Amino acid change Codon change Co-located Variation Extra
chr20_10000117_C/T chr20:10000117 T SNAP25-AS1 NR_040710 Transcript downstream_gene_variant - - rs4816203 DISTANCE=4343
chr20_10000211_C/T chr20:10000211 T SNAP25-AS1 NR_040710 Transcript downstream_gene_variant - - rs4813908 DISTANCE=4249
chr20_10000439_T/G chr20:10000439 G SNAP25-AS1 NR_040710 Transcript downstream_gene_variant - - rs4816204 DISTANCE=4021
chr20_10000598_T/A chr20:10000598 A SNAP25-AS1 NR_040710 Transcript downstream_gene_variant - - rs6057087 DISTANCE=3862
...
...
...

What if your colleague gave you a list of rs IDs, and you want to know what genes they fall in and what changes they might cause? Just pass vai.pl your list of rs IDs as an input file, and it will do the rest!

$ vai.pl hg19 listOfRsIDs.txt

## ENSEMBL VARIANT EFFECT PREDICTOR format (UCSC Variant Annotation Integrator)
## Output produced at 2017-05-05 13:45:46
## Connected to UCSC database hg19
## Variants: Variant Identifiers (/data/tmp/hgv/hg19_bd61d73837d586acba8b9a674d8bf351.vcf)
## Transcripts: RefSeq Genes (hg19.refGene)
Uploaded Variation Location Allele Gene Feature Feature type Consequence Position in cDNA Position in CDS Position in protein Amino acid change Codon change Co-located Variation Extra
rs762221666 chr1:36228116 T CLSPN NM_001330490 Transcript intron_variant - - - - - INTRON=4/24
rs762221666 chr1:36228116 T CLSPN NM_001190481 Transcript intron_variant - - - - - INTRON=4/23
rs762221666 chr1:36228116 T CLSPN NM_022111 Transcript intron_variant - - - - - INTRON=4/24
rs528917690 chr1:229013556 G - - - intergenic_variant - - - - - - -
rs558192635 chr10:25615277 C GPR158 NM_020752 Transcript intron_variant - - - - - INTRON=2/10
rs769006799 chr10:26225804 T LOC101929073 NR_120650 Transcript upstream_gene_variant - - - DISTANCE=3165
...
...
...

Note the missing gene name for the rs528917690, because this is an intergenic variant.

What if you only care about the variants that fall on chr22? vai.pl supports a --position option built just for that:

$ vai.pl hg19 --rsId --position=chr22 chr22.1000GenomesPhase3.vcf.gz

## ENSEMBL VARIANT EFFECT PREDICTOR format (UCSC Variant Annotation Integrator)
## Output produced at 2017-05-05 13:36:32
## Connected to UCSC database hg19
## Variants: from file or URL (/hive/users/chmalee/hgVaiScriptTesting/chr221000GenomesPhase3.vcf.gz)
## Transcripts: RefSeq Genes (hg19.refGene)
## dbSNP: Simple Nucleotide Polymorphisms (dbSNP 149) (/gbdb/hg19/vai/snp149.bed4.bb)
Uploaded Variation Location Allele Gene Feature Feature type Consequence Position in cDNA Position in CDS Position in protein Amino acid change Codon change Co-located Variation Extra
rs587697622 chr22:16050075 G - - - intergenic_variant - - - - - rs587697622 -
rs587755077 chr22:16050115 A - - - intergenic_variant - - - - - rs587755077 -
rs587654921 chr22:16050213 T - - - intergenic_variant - - - - - rs587654921 -
rs587712275 chr22:16050319 T - - - intergenic_variant - - - - - rs587712275 -
rs587769434 chr22:16050527 A - - - intergenic_variant - - - - - rs587769434 -
...
...
...

Ok great, but web-based VAI lets me annotate only specific variants, and I don’t care about intronic variants, upstream/downstream variants, or intergenic variants, only those that fall within exons as annotated by the GENCODE V24 track. Well good thing vai.pl supports annotation via specific gene tracks with the --geneTrack option, and can include/exclude different functional types with the include_ option:

$ vai.pl hg38 --include_intron=off --include_upDownstream=off --include_intergenic=off \
--geneTrack=wgEncodeGencodeCompV24 listOfRsIDs.txt

## ENSEMBL VARIANT EFFECT PREDICTOR format (UCSC Variant Annotation Integrator)
## Output produced at 2017-05-05 13:53:57
## Connected to UCSC database hg38
## Variants: Variant Identifiers (/data/tmp/hgv/hg38_bd61d73837d586acba8b9a674d8bf351.vcf)
## Transcripts: Comprehensive Gene Annotation Set from GENCODE Version 24 (Ensembl 83) (hg38.wgEncodeGencodeCompV24)
Uploaded Variation Location Allele Gene Feature Feature type Consequence Position in cDNA Position in CDS Position in protein Amino acid change Codon change Co-located Variation Extra
rs371031144 chr13:112864559 A ATP11A ENST00000471555.5 Transcript NMD_transcript_variant - - - INTRON=8/12
rs750654524 chr16:57996479 T ZNF319 ENST00000299237.2 Transcript 3_prime_UTR_variant 2410 - - EXON=2/2
rs575863935 chr16:83575109 A CDH13 ENST00000539548.6 Transcript NMD_transcript_variant - - - INTRON=6/12
rs78060447 chr4:83316348 C HPSE ENST00000507150.5 Transcript NMD_transcript_variant - - - INTRON=4/11
...
...
...

By default, vai.pl includes all functional types, use the --include_type=off switch to turn them off. vai.pl also limits output to only 10,000 variants, but you can override this with the --variantLimit option. The following example compares the number of annotated variants with default settings and with the --variantLimit option (Please note the grep command at the end is only a rough approximation of finding all the unique variants):

$ vai.pl hg19 ftp://ngs.sanger.ac.uk/production/hrc/HRC.r1-1/HRC.r1-1.GRCh37.wgs.mac5.sites.vcf.gz > HRC.vai
$ grep -v ^# HRC.vai | grep -v ^Uploaded | awk '{print $2 ":" $1;}' | uniq | wc -l
9992
$ vai.pl hg19 --variantLimit=10000000 ftp://ngs.sanger.ac.uk/production/hrc/HRC.r1-1/HRC.r1-1.GRCh37.wgs.mac5.sites.vcf.gz > HRC.vai
$ grep -v ^# HRC.vai | grep -v ^Uploaded | awk '{print $2 ":" $1;}' | uniq | wc -l
9992195

Unfortunately the script will not annotate more than approximately 10,000,000 variants due to the amount of memory needed (it caps its usage at 6GB; this may change in the future), so setting the --variantLimit option any higher than 10,000,000 will not work. Instead you will need to split up your VCF file. For a full list of all the options outlined here as well as others, run vai.pl with no arguments to get the usage message.

The script has some other drawbacks as well. For one, as previously mentioned, the script can only be run on a GBiB, a mirror site (installed via the Genome Browser in the Cloud (GBiC) script or a manual installation), or another machine running our CGIs. This is because under the hood the script uses the existing web-based VAI executable to run, which in turn requires either manual compilation of our source code, or a precompiled binary from our downloads server. Furthermore, VAI is tightly coupled to our genome databases and files.

Secondly, users will need to have a .hg.conf file in their home directory in order to run the program. The .hg.conf file is a file that a majority of UCSC-specific utilities use to set various configuration options. This file specifies options like which MySQL server to point to (a local server with private data), a fallback MySQL server if one isn’t available (UCSC public MySQL server), the primary location of bigData files, etc. Our source tree includes a very minimal hg.conf file that should allow basic usage of the script.

Different system setups will require different options in each users’ hg.conf settings, and if you are running a full mirror, then the CGIs will require their own hg.conf, separate from each user who may be running vai.pl! GBiB users should have a functioning .hg.conf file set up already, and thus for the script to work out of the box, you should only need to change the udc.cacheDir setting from:
udc.cacheDir=/data/trash/udcCache

to a user-writable directory such as:
udcCacheDir=./udcCache

Mirror users won’t have an .hg.conf file by default, but can create one and add the line:
include /usr/local/apache/cgi-bin/hg.conf

This will take care of most of the work outside of fine-tuning a few settings like the udc.cacheDir mentioned previously. For more information about hg.conf parameters and settings, please see the example hg.conf file here. Any questions about fine-tuning these parameters should be sent to our public support forum mentioned below.

Download

vai.pl is available from the UCSC Genome Browser Store via download of the GBiB (use the gbibAddTools command), GBiC (use the browserSetup.sh addTools command), or full source. vai.pl is free for non-commercial use. If you encounter issues or have any questions while running vai.pl, please send your questions to our public mailing list at genome@soe.ucsc.edu, or if your question involves private data to genome-www@soe.ucsc.edu.

References

Choice of transcripts and software has a large effect on variant annotation.
McCarthy DJ, Humburg P, Kanapin A, Rivas MA, Gaulton K, Cazier JB, Donnelly P.
Genome Med. 2014 Mar 31;6(3):26. doi: 10.1186/gm543.

UCSC Data Integrator and Variant Annotation Integrator.
Hinrichs AS, Raney BJ, Speir ML, Rhead B, Casper J, Karolchik D, Kuhn RM, Rosenbloom KR, Zweig AS, Haussler D, Kent WJ.
Bioinformatics. 2016 May 1;32(9):1430-2. doi: 10.1093/bioinformatics/btv766.


If after reading this blog post you have any public questions, please email genome@soe.ucsc.edu. All messages sent to that address are archived on a publicly accessible forum. If your question includes sensitive data, you may send it instead to genome-www@soe.ucsc.edu.

How portable is your track hub? Use hubCheck to find out!

Track and assembly hubs are collections of data that are hosted on your servers and can be displayed using the UCSC Genome Browser and other genome browsers supporting the UCSC track hub format. Track hubs allow for the visualization of data on assemblies that we already host (such as the human or mouse genomes), while assembly hubs can be used to create genome browsers for any genome assembly of your choosing.

Hubs depend on a number of different plain text configuration files. The most important are the trackDb.txt files for each assembly in your hub. These files contain the track configuration settings, also known as “trackDb settings”, that control how the track displays in the Genome Browser as well as the display of the item detail pages. You can see the trackDb settings available for hubs on the Hub Track Database Definition page.

As the track hub format has grown in popularity, other genome browsers, including Ensembl, Biodalliance, and the WashU Epigenome Browser, have implemented support for the UCSC track hub format. The Ensembl genome browser currently boasts fairly comprehensive support of the UCSC track hub format. In addition to supporting track hubs on their site, the Ensembl team has also created a Track Hub Registry that pulls hubs listed on our Public Hubs page into a centralized database alongside those hubs submitted to their registry. In an attempt to make the adoption of our track hub format easier, we talked to the other genome browsers about what settings were core to a track hub being, well, a track hub. We sort the list of hundreds of settings into various support levels, which include:

  • Required – needed to display a hub across the different browsers.
  • Base – non-required settings that are likely to be supported by other genome browsers
  • Full – all other trackDb settings fully supported in the UCSC Genome Browser
  • New – settings introduced since the last versioned release, may change between now and the next versioned release
  • Deprecated – settings that may currently work, but could cease to work in the future as they are not being actively developed

We periodically increment the trackDb version number as major updates and changes are made to the settings. The latest change — version 2 — included settings related to the release of several “big*” file types, such as bigGenePred, bigPsl, bigChain, bigMaf, and CRAM. It also included moving several settings (html, priority, colorByStrand, autoScale, spectrum) from the “full” level to the “base” level to indicate that they are supported at other genome browsers (at this time primarily Ensembl).

During the initial versioning process, we improved the “hubCheck” utility to check the support of the trackDb settings used in your hub against our master list of trackDb settings, by version and support level. The hubCheck tool can be utilised in a variety of different ways; principally it checks if your hub works, but it can also list your hub’s settings and their support levels (required, deprecated, base, full and new) as well as check the support of your settings against any genome browser.  For example, to test compatibility with Ensembl (which supports the ‘base’ level of hub settings), use the command:

hubCheck -checkSettings -level=base http://genome.ucsc.edu/goldenPath/help/examples/hubDirectory/hub.txt

You can see more examples of how you might use hubCheck to check the compatibility of your hub with other genome browsers in our help documentation. To acquire hubCheck, you can click Downloads from the top blue menu bar and then select Utilities and navigate to the utilities directory.

If you have questions about creating or validating your track and assembly hubs, please feel free to contact us!

For more information on hubs in the UCSC Genome Browser, please see the following pages:

For more information on hubs in other genome browsers, see their help pages here:

Questions about other genome browsers support for hubs should be directed to their mailing lists.


If after reading this blog post you have any public questions, please email genome@soe.ucsc.edu. All messages sent to that address are archived on a publicly accessible forum. If your question includes sensitive data, you may send it instead to genome-www@soe.ucsc.edu.

The new NCBI RefSeq tracks and You

The release of the new NCBI RefSeq track marks a major shift in how we include annotations from NCBI’s Reference Sequence Database (RefSeq) in the UCSC Genome Browser. This new track is a composite track that contains the combined set of curated and predicted annotations from the RefSeq database for hg38/GRCh38. It also contains tracks that break up the annotation set into a few subsets. These subsets include only the curated transcripts (NM, NR, or YP transcripts), only the predicted transcripts (XM or XR transcripts), all of the other annotations from RefSeq that don’t fit into the curated or predicted subsets, and the alignments of the curated and predicted transcripts to the genome. All of the coordinates and alignments in these tracks are provided by the RefSeq group.

This new NCBI RefSeq composite also includes a “UCSC RefSeq” track that is based on our original method of producing the “RefSeq Genes” track. This “UCSC RefSeq” track is built by aligning RNAs obtained from the RefSeq Database to the genome. In the early days of the UCSC Genome Browser, only RNA sequences were provided by RefSeq, so we used BLAT to align them to the genome. This was a good solution in the past, but over time this method has led to some issues with transcripts matching to multiple places and our alignments of small exons or other regions differing slightly from those found in the RefSeq database. This type of minor alignment difference can be seen in the following session, where you can see that the RefSeq Curated (top) and UCSC RefSeq (bottom) tracks place the small fifth exon in transcript NM_001130970 at different locations due to the fact that there are multiple matches to this exon sequence in that region.

The new set of RefSeq tracks differs from the “UCSC RefSeq” track in a few key ways. First, as mentioned previously, the new tracks are based entirely on positions and alignments provided by RefSeq. Second, this track is currently only available for the hg38/GRCh38 assembly. This means that if you obtain the hg38 coordinates for a RefSeq transcript from the UCSC Genome Browser, these coordinates should be the same as those from the entry found at NCBI’s RefSeq Database. Lastly, these new NCBI RefSeq tracks include predicted transcripts, which were absent from our original RefSeq track.

This has been a long and exciting collaboration between the UCSC Genome Browser staff and NCBI’s RefSeq group. We trust that this full complement of tracks from the Reference Sequence Database will be helpful to you, our Browser users. We hope to bring these tracks to more genome assemblies in the future.


If after reading this blog post you have any public questions, please email genome@soe.ucsc.edu. All messages sent to that address are archived on a publicly accessible forum. If your question includes sensitive data, you may send it instead to genome-www@soe.ucsc.edu.

The UCSC Genome Browser Coordinate Counting Systems

If you think dogs can’t count, try putting three dog biscuits in your pocket and then giving Fido only two of them.  

~Phil Pastoret

“Counting is easy. Right?”

I say this with my hand out, my thumb and 4 fingers spread out. With my other hand’s pointer finger, I simply count each digit, “one, two, three, four, five.” Easy.

But what happens when you start counting at 0 instead of 1? You can see that you have 5 digits (4 fingers and a thumb), but how do you calculate the size of your range?

With your hand in mind as an example, let’s look at counting conventions as they relate to bioinformatics and the UCSC Genome Browser genomic coordinate systems.

The UCSC Genome Browser uses two different systems:

“1-start, fully-closed” = coordinates positioned within the web-based UCSC Genome Browser. “0-start, half-open” = coordinates stored in database tables.
Table 1. UCSC Genome Browser coordinate systems summary
0-start, half-open (0-based) 1-start, fully-closed (1-based)
“BED” format (Browser Extensible Data):
chr1 127140000 127140001
Note: Spaces, not punctuation
When using BED format, browser & utilities
assume coords are 0-start, half-open.
“Position” format:
chr1:127140001-127140001
Note: Punctuation used, no spaces
When using “position” format, browser & utilities
assume coords are 1-start, fully-closed.
Stored in UCSC Genome Browser tables Positioned in UCSC Genome Browser web interface
To convert to 1-start, fully-closed:
add 1 to start, end = same
To convert to 0-start, half-open:
subtract 1 from start, end = same
 

Section 1: Interval types

0-start vs. 1-start : Does counting start at 0 or 1?
Synonyms:
Sometimes referred to as “0-based” vs “1-based” or 
“0-relative vs “1-relative.”

Interval Types
For a counted range, is the specified interval fully-open, fully-closed, or a hybrid-interval (e.g., half-open)?

Ok, time to flashback to math class!
You might recall that specifying an interval type as open, closed (or a combination, e.g., “half-open”) refers to whether or not the endpoints of the interval are included in the set. For further explanation, see the
interval math terminology wiki article. Figure 1 below describes various interval types.

Figure1

Figure 1. (To enlarge, click image.) Description of interval types.

Section 2: Interval types in the UCSC Genome Browser

UCSC Genome Browser web interface = “1-start, fully-closed”

A common counting convention is a system that we all used when we first learned to count the fingers on our hands; this is referred to as the “one-based, fully-closed” system (Figure 2, below). Note that an extra step is needed to calculate the range total (5).

The “1-start, fully-closed” system is what you SEE when using the UCSC Genome Browser web interface. However, all positional data that are stored in database tables use a different system.

1-starthandfinal

Figure 2. (To enlarge, click image.) 1-start, fully-closed interval. Most common counting convention. Used within the UCSC Genome Browser web interface (but not used in UCSC Genome Browser databases/tables). We calculate that we have 5 digits because 5 (pinky finger, range end) – 1 (the thumb, range start) = 4. We then need to add one to calculate the correct range; 4+1= 5.

UCSC Genome Browser tables = “0-start, half-open”

While the commonly-used “one-start, fully-closed” system is more intuitive, it is not always the most efficient method for performing calculations in bioinformatic systems, because an additional step is required to calculate the size of the base-pair (bp) range.

To increase efficiency, the UCSC Genome Browser uses a “hybrid-interval” coordinate system for storing coordinates in databases/tables that is referred to as “0-start, half-open” (see Figure 3, below).

Although coordinates in the web browser are converted to the more human-readable “1-start, fully-closed” system, coordinates are stored in database tables as “0-start, half-open.” You may have heard various terms to express this 0-start system:

Synonyms for “0-start, half-open”

  • 0-based, half-open
  • 0-based start, 1-based end
    • Note: This is not technically accurate, but conceptually helpful. A “1-based end” refers to the end of the range being included, as in the common “1-based, fully-closed” system.
  • 0-start, hybrid-interval (interval type is: start-included, end-excluded)

newhand0-startfinal

Figure 3. (To enlarge, click image.) The UCSC Genome Browser coordinate system for databases/tables (not the web interface) is “0-start, half-open” where start is included (closed-interval), and stop is excluded (open-interval). We calculate that we have 5 digits because 5 (range end after pinky finger) – 0 (the thumb, range start)  = 5.

Another example which compares 0-start and 1-start systems is seen below, in Figure 4. This figure describes the differences in defining and calculating the range for a specified sequence highlighted in yellow, “T, C, G, A.”

finalgrid

Figure 4. (To enlarge, click image.)  Calculation of genomic range for comparing “1-start, fully-closed” vs. “0-start, half-open” counting systems.

Section 3: Formatting

Coordinate formatting indicates interval type

The UCSC Genome Browser and many of its related command-line utilities distinguish two types of formatted coordinates and make assumptions of each type.

The “Position” format (referring to the “1-start, fully-closed” system as coordinates are “positioned” in the browser)

  • Written as: chr1:127140001-127140001
  • No spaces.
  • Includes punctuation: a colon after the chromosome, and a dash between the start and end coordinates.
  • When in this format, the assumption is that the coordinate is 1-start, fully-closed.

The “BED” format (referring to the “0-start, half-open” system)

  • Written as: chr1 127140000 127140001
  • Spaces between chromosome, start coordinate, and end coordinate.
  • No punctuation.
  • When in this format, the assumption is that the coordinates are 0-start, half-open.

Section 4: Examples

SNP example

What we SEE in the Genome Browser interface itself is the “1-start, fully-closed” system. However, these data are not STORED in the UCSC Genome Browser databases and tables in the same way. The UCSC Genome Browser databases store coordinates in the “0-start, half-open” coordinate system.

Table 2. SNP coordinates in web browser (1-start) vs table (0-start)
rs782519173 (hg38) Start End
Positioned in web browser: 1-start, fully-closed  133255708  133255708
Stored in table: 0-start, half-open  133255707  133255708

LiftOver examples and coordinate formatting

Let’s take a look at the two types of coordinate formatting (“BED” and “position”) when using the UCSC Genome Browser web-based and command-line utility liftOver tools.

1) Web-based LiftOver example

Below is an example from the UCSC Genome Browser’s web-based LiftOver tool (Home > Tools > LiftOver). Depending on how input coordinates are formatted, web-based LiftOver will assume the associated coordinate system and output the results in the same format.

Table 3. UCSC Genome Browser web-based LiftOver and “position” coordinate formatting
Input: Assembly = panTro3
chr1
:127140001127140001
Output: Lifts to this position in hg19:
chr1:110255313110255313
Notes: If your input is entered with the “position” formatted coords (1-start, fully-closed),
the browser will also output the same “position” format. (Note positional format
includes “:” and “-” and no spaces.)
Table 4. UCSC Genome Browser web-based LiftOver and “BED” coordinate formatting
Input: Assembly = panTro3
chr1 127140000 127140001
Output: Lifts to this position in hg19:
chr1 110255312 110255313
Notes: If your input is entered with the “BED” formatted coords (0-start, half-open), the
browser will also output the same “BED” format. (Note BED format contains no
punctuation and includes spaces.)
 * Note that the web-based output file extension is misleading in this case; while titled “*.bed” the positional output is not actually in “0-start, half-open” BED format, because the 1-start, fully-closed “positional” format was used for input. 

 2) Command-line liftOver utility example

When using the command-line utility of liftOver, understanding coordinate formatting is also important. Just like the web-based tool, coordinate formatting specifies either the “0-start half-open” or the “1-start fully-closed” convention. For example, if you have a list of 1-start “position” formatted coordinates, and you want to use the command-line liftOver utility, you will need to specify in your command that you are using “position” formatted coordinates to the liftOver utility.

To view the liftOver utility usage statement and options, enter “liftOver” on your command-line (with no other arguments, and without the quotes).

Table 5. UCSC Genome Browser command-line liftOver and “position” coordinate formatting
Input:
(panTro3.txt)
chr1:127140001127140001
Command: liftOver -positions panTro3.txt liftOver/panTro3ToHg19.over.chain.gz mapped unMapped
Output: chr1:110255313110255313
via “mapped” file for hg19
Notes: Note: Must specify “-positions” for 1-start “position” format in command-line liftOver
Table 6. UCSC Genome Browser command-line liftOver and “BED” coordinate formatting
Input:
(panTro3.bed)
chr1 127140000 127140001
Command: liftOver panTro3.bed liftOver/panTro3ToHg19.over.chain.gz mapped unMapped
Output: chr1 110255312 110255313
via “mapped” file for hg19
Notes: Note: No special argument needed, 0-start “BED” formatted coordinates are default. 

Wiggle Files

The wiggle (WIG) format is used for dense, continuous data where graphing is represented in the browser. Wiggle files of variableStep or fixedStep data use “1-start, fully-closed” coordinates. Like all other UCSC Genome Browser data, these coordinates are positioned in the browser as “1-start, fully-closed.”

Note: Many other formats outside of the UCSC Genome Browser use 1-start coordinate systems, such as GTF/GFF.

Table 7. UCSC Genome Browser wiggle files & coordinate systems
File Type Wiggle file Coordinate system as positioned
in UCSC Genome Browser
bedGraph -> bigWig 0-start, half-open 1-start, fully-closed
wiggle variableStep -> bigWig 1-start, fully-closed 1-start, fully-closed
wiggle fixedStep -> bigWig 1-start, fully-closed 1-start, fully-closed

 Section 5: Resources


If after reading this blog post you have any public questions, please email genome@soe.ucsc.edu. All messages sent to that address are archived on a publicly accessible forum. If your question includes sensitive data, you may send it instead to genome-www@soe.ucsc.edu.

GTEx Resources in the Browser

Have you been wondering when we’ll get some of that next-gen gene expression in human tissues up as tracks in the browser? The GNF Atlas microarray tracks are so 2004… Yes, we do have RNA-seq from ENCODE cell lines, but you can get only so far with cell lines (are they even human?). Well, wait no longer! Once we learned what the GTEx folks are up to – RNA-seq and genotyping of samples from 53 tissues in many hundreds of donors – we just had to get on board! Read on for details…

The NIH Genotype-Tissue Expression (GTEx) project was created to establish a sample and data resource for studies on the relationship between genetic variation and gene expression in multiple human tissues. In April this year the Genome Browser released the GTEx Gene Expression track, which showcases data from the GTEx midpoint milestone data release (V6, October 2015) – 8555 tissue samples obtained from 570 adult postmortem individuals. The track shows median expression level per tissue at each gene via a new bar graph display:

gtexGeneTcap3

The height of each bar represents the median expression level across all samples for a tissue, and the bar color indicates the tissue (we are using GTEx publication color conventions). You can see the gene description and tissue name with expression level when you mouseover, and can view the tissue legend in glorious detail on the track configuration page. Above, notice the 3 highly expressed tissues for TCAP protein (titin-cap, used in muscle assembly) – unsurprisingly in this case, heart (2 sub-tissues) and skeletal muscle.

In the tissue mix sampled by GTEx, you’ll find a dozen brain sub-tissues, a handful of cardiovascular tissues, and bits from digestive, reproductive, and endocrine systems. For a nice summary of the tissues assayed, check out the GTEx project portal. Not so interested in all the tissues? Turn on the tissue filter and limit the graph to show just your faves!

Once you’ve found your favorite gene, you can drill down for more detail. A nice boxplot showing the range for all samples and the sample count is right here on the details page:

gtexBoxplotTcap

You’ll also see this plot on the new RNA-Seq Expression panel of the UCSC Genes detail page:

gTexGeneDetailsMenu

If gene-level calls aren’t your thing – you’re more of a deep diver and want to see the actual RNA-seq coverage – you might find the newly released GTEx Signal Hub just your style. We were fortunate to be able to team up with the Global Alliance crowd here within the UCSC Genomics Institute and convince them to pump all the available GTEx RNA-seq through their hot new Toil pipeline (along with twice as much cancer data) to produce signal graphs. A round of ‘biggification’, lifting and track configuration (gotta have those GTEx colors!) produced the hub. Find it on the Public Hubs panel of the Track Hubs page, which you can navigate to via the My Data > Track Hubs menu option in the top blue bar.

Did I mention you can find the GTEx gene track and the GTEx Signal hub on both the hg19 (GRCh36) and hg38 (GRCh37) genome browsers?

Give the new tracks a spin! To get you started, here’s a session:

gtexSessionForBlog

Now enjoy!!


If after reading this blog post you have any public questions, please email genome@soe.ucsc.edu. All messages sent to that address are archived on a publicly accessible forum. If your question includes sensitive data, you may send it instead to genome-www@soe.ucsc.edu.

The new Genome Browser gateway

New UCSC Genome Browser gateway page design

New UCSC Genome Browser gateway page design

The opinions expressed here are those of the author, Cath Tyner, and do not necessarily reflect those of the University of California Santa Cruz or any of its units.

Maybe it’s just me, but I can clearly remember the excitement of getting brand new sparkly shoes as a young kid.  Half the excitement was picking out the shoes – my siblings and I would try on every potential new-shoe option. There were high standards, of course; rigorous criteria that had to be thoroughly discussed and tested. Could they make you jump SUPER high? Low tops or high tops? Classic laces or cutting edge velcro? After finally picking out the perfect pair and racing to put them on with maniacal laughter, the reality set in. New shoes. Ahhhh. The excitement of showing off my new kicks at school was only one night away.

That’s a little bit how we all felt when we unveiled the brand new sparkly Genome Browser gateway page  earlier this week. This was a project that had been “in the works” for quite a long time, starting from ideas and drawings, moving into design phases, and finally maturing into many iterations of testable versions as the development process gained its own momentum. This project soon had a life of its own – we all became shepherds as we guided it into what we finally knew was a final product.

The things we are most excited about? We’ve already received feedback that the new human-centric phylogenetically ordered tree menu is downright awesome (and we think so too).  For me, the graphics and colors pull me in, inviting me to visually scroll through our entire genome species collection. With a flick of the scroll handle on the tree menu, I can zip from “us humans” all the way down to sea hare or Ebola virus; within two seconds, I’ve just traveled through millions and millions of evolutionary years. Based on NCBI’s taxonomy database, the “tree menu” provides an interactive way to explore our genome species collection. Little known fact: Try hovering over one of the “branches” of the tree (the horizontal and vertical lines connecting all species) and see what you find!

Example of mouse hover on tree menu branch

Example of mouse hover on tree menu branch

Another exciting new feature that makes our eyes light up is the autocomplete search function and “popular species” button shortcuts:

Button shortcuts & autocomplete search

Button shortcuts & autocomplete search

We know that over 95% of you will benefit from our “popular species” buttons as quick access shortcuts to the genomes that you use most. We also believe that just about everyone will benefit from the autocomplete search function. For example, you can enter “fish” to see genomes from our aquatic friends, or you can enter something as specific as “hg38” to load a particular assembly version. With a whopping 276 genomes and counting, autocomplete search is a celebrated new feature! The same autocomplete function works great for our public genome hubs; try typing “plant” to see related hubs.

Want to jump to your favorite gene in the genome browser? The “position/search term” functionality remains just as efficient – just enter a genomic position, gene symbol, or search term, lean back in your comfy chair, and press “GO.” You’re there.

To see more details, including a few menu option changes, visit the gateway announcement on our news page and watch the short gateway video tour.

We sincerely hope you enjoy the new gateway page as much as we do – and as always, we invite you to contact us with questions, concerns, and compliments. 😉


If after reading this blog post you have any public questions, please email genome@soe.ucsc.edu. All messages sent to that address are archived on a publicly accessible forum. If your question includes sensitive data, you may send it instead to genome-www@soe.ucsc.edu.

How to share your UCSC screenthoughts

by Robert Kuhn      August 12, 2015

The UCSC Genome Browser is great tool for visualizing your data alongside a ton of data from all over the place.  Perhaps, at long last, you have loaded up a gene set, the supporting mRNAs and maybe the SNPs from OMIM or dbSNP, and the Conservation track to make a great point.

Now you want to save that thought, or share it with a colleague, or make a slide for a meeting, or publish it in a paper. Saving your screenthought can take two forms: static or dynamic.  You can snap and save a picture of the screen, or you can share a link to an active Genome Browser.  We’ll talk about both approaches here and discuss some of the advantages and pitfalls of each.

Share a static image.    You can always take a screen grab and throw it onto a slide with little effort.  The screen resolution is fine for  a slide, because your computer and your slide will viewFingerboth be 72 or 96 dpi.  But, if you try that for a publication, your image will have to be really small (scale down 3x in each dimension to get 300 dpi for print) or it will be unacceptably fuzzy.

To get high resolution images for publication, use the Browser’s .pdf export function to allow the vector-graphics image to scale to full journal size and resolution. Look for the .pdf output in the “View” pulldown menu at the top of the Browser page.  Both the chromosome ideogram and the main Browser graphic can be saved in this fashion.

Share a dynamic session, but DO NOT copy a URL.  To save a dynamic screen session that would allow you or others to look around, add more data tracks, check out other genes, etc., you might be tempted to simply copy the URL from your Firefox or Chrome web browser.  That might even seem to work OK at first, but it is in fact not a stable link and can lead to weird Browser behavior.  Worse, you may not even be sharing what you think you are, and will never know it.

Let’s break down a URL as copied directly from my Firefox and see how it plays out.

url2

This URL contains a parameter, hgsid, which is actually a pointer to a row in a UCSC database identifying your session and keeping the state of all your variables (we borrowed the name “cart”).  If you send this URL to someone, yet keep browsing around, your cart will continue to change as you work, and your friend will see the latest state your Genome Browser is in when she clicks the link. The original state of your cart when you shared the URL is long gone before she sees it.

Your shared URL might even appear to work OK because two of the variables in the URL, db (database) and position, will override values stored in your cart (cart variables are separated by an ampersand).  Your friend will see the right genome assembly (db variable) and location (position variable) and think she’s seeing what you want.  But, if you have turned any data tracks on or off in the interim, or removed a custom track, those changes will also be part of what she sees. The original state is lost.  A different colleague could click the link at some other time and see something different still.

As an experiment, here is that same URL in a form you can click or copy/paste into your web browser:

http://genome.ucsc.edu/cgi-bin/hgTracks?db=hg19&position=chr8%3A38311140-38327276&hgsid=438231169_c2xrrbHK2bQhTuHqjEIOniXGqenu

Does it look like this?

Untitled

That’s what it looked like when I shared the URL. Your click will show the 5’ end of the FGFR1 gene region on human assembly hg19 (because the URL has explicitly included db and position variables), but who knows what tracks might be turned on or off in the interim? Whatever the last person to click it did to it will rule. Every person who reads this blog and clicks the link can change the track configuration for whomever comes next. Only the db and position are going to persist.

Quick-and-dirty URL hack.    If you really want a quick-and-dirty way to share a link, here are a couple of suggestions.  You could send the link as it is above, then strip a few characters out of the hgsid in the URL in your own browser and refresh.  Because the new long hgsid string will not exist in our database, you will be assigned a new hgsid and the state of the old one will stick – until your friend starts messing with it.  Or you could strip out the hgsid parameter entirely and add in other parameters that define the tracks you want to turn on, e.g.:

&knownGene=pack&snp142=dense

That will better define the tracks you want, but it is neither as stable nor as easy as saving a Session. You can use “hide,” too, to be sure certain tracks are turned off. Read more about configuring your links here.

Share a stable dynamic Session.    The best way to save a train of thought in a stable fashion is via the Saved Session tools under the “My Data” pulldown menu. A Saved Session acts as a mydataFingerstable snapshot of all the details of your Browser view.  Saving a thought using this feature requires a login, but it allows you to save the state of a Browser session (semi)-permanently. Anyone viewing your session will be able to further browse around the genome without affecting the session you saved.  After you have saved a session, you will see a “Browser” link that can be copied and shared.

For example, to load the view above as a stable session, try this link (no login is required to view some else’s Saved Session):

http://genome.ucsc.edu/cgi-bin/hgTracks?hgS_doOtherUser=submit&hgS_otherUserName=sessionGallery&hgS_otherUserSessionName=hg19_watsonKriek

Although anyone with this URL can view this session, no one can change it unless logged in as user “SessionGallery.”

In the past we endeavored to save the Session for at least 3-4 months after the last time it was viewed, and custom tracks in sessions were subject to persist for at least 48 hours after the last time they were viewed. We have now moved to not remove session data, unless deleted, and to not remove custom tracks in sessions.  We still encourage people to save their Session cart to a local file using the “Save Settings” feature (and to keep backups of all their custom tracks on a local machine).  That way, you can load your Session settings any time and onto any copy of the Browser (such as to the European mirror or a local Genome Browser-in-a-Box) and avoid any possible loss of data due to unforeseen circumstances.  We do the best we can to maintain our servers so that you do not lose your sessions, but computers are only human and they break.

Really stable sessions.    If you are looking to create a permanent link for a publication, you should consider hosting your downloaded Session and any of your own custom data on a server you control (such as in a Track Hub). It will still be loaded onto the UCSC Genome Browser, but you are not at the mercy of California earthquakes, wildfires or crashed servers (except for your own).  You can read more about building links to remotely hosted user information here and on our Session’s Gallery page here.

On both pages you can learn about the following parameters for forming links to launch sessions from your hub:

hgS_doLoadUrl=submit
hgS_loadUrlName=

We hope we have given you some food for thought about how to make the Genome Browser more useful in your work.  Using a reliable method for saving and sharing sessions is great way to avoid the frustration of lost data and misleading links.  Stay tuned for more useful Browser tips in future blogs.

New default gene set on GRCh38: GENCODE Basic genes

Screen Shot 2015-06-29 at 3.32.45 PM

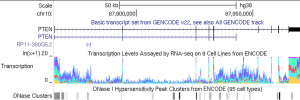
Genome Browser screen shot of the GRCh38 (hg38) human assembly showing the GENCODE Basic track opened in the PTEN region on chromosome 10.

As of Monday, July 29, 2015, the UCSC Genome Browser will use the GENCODE v22 comprehensive gene set as its default gene set on the human genome assembly GRCh38 (hg38), replacing the previous default set of genes created here at UCSC using code written by Jim Kent. This track, which is labeled as “GENCODE Basic” in the Genes and Gene Predictions track group, replaces UCSC Genes track as the default gene set.  We’re making this change in recognition of the value of reducing the number of competing gene sets used by the bioinformatics community.  With this change we will be using the same set of genes as Ensembl, reducing the potential for confusion, especially in clinical settings.

We’ve kept the same familiar UCSC Genes schema for the new gene set, using nearly all the same table names and fields that appeared in earlier versions of UCSC Genes. Hopefully this will make the transition to the new GENCODE models easier. Every transcript in the new set has both a UCSC ID and a GENCODE transcript ID. There are a couple of new tables: knownCds, which has the coding frame numbers for each gene, and knownToMrna, which captures the association to GenBank mRNAs. A couple tables are no longer present: knownGeneTxMrna and knownGeneTxPep.

By default, we display only the transcripts tagged as “basic” by the GENCODE Consortium. However, all the transcripts in the GENCODE comprehensive set are present in the tables. You can view them in the browser by selecting “show comprehensive set” in the “Show” section of the track’s description page. On that same page, you can also configure the browser to label the genes with the GENCODE transcript IDs by selecting “GENCODE Transcript ID” label option.

The new gene set has 195,178 total transcripts, compared with 104,178 in the previous UCSC Genes version. The total number of canonical genes, now defined using the GENCODE gene loci ( ENSG* identifiers), has increased from 48,424 to 49,534.

Comparing the previous gene set with the new version:

  • 9,459 transcripts are identical.
  • 22,088 transcripts were not carried forward to the new version.
  • 43,681 have consistent splicing, but changes in the UTR.
  • 28,950 transcripts overlap with those in the previous set, but have
    at least one different splice.

We plan to continue using the previous UCSC computational pipeline to generate the default gene set on the mouse assembly, GRCm38 (mm10), for the foreseeable future. We will also periodically update the old UCSC-computed gene set on the human GRCh38 assembly as an ancillary track (“Old UCSC Genes”) without the rich set of link-outs we maintain for the default gene set.


If after reading this blog post you have any public questions, please email genome@soe.ucsc.edu. All messages sent to that address are archived on a publicly accessible forum. If your question includes sensitive data, you may send it instead to genome-www@soe.ucsc.edu.

Introducing the Genome Browser YouTube Channel

Here at the Genome Browser we’re constantly looking for ways to improve the Browser and make it more accessible. A big part of that is making it as easy as possible for people to learn how to use our tools to best serve their research. In the past this has included setup and maintenance of documentation, including our help docs as well as a dedicated wiki site, where browser staffers and external users alike have shared content. We also continue to offer real-time support on our mailing list (genome@soe.ucsc.edu).

Thanks to funding support from the NHGRI we were recently able to amp up our training efforts in two ways. We now have a program whereby interested groups can economically host a Genome Browser workshop at their institution. For more information, fill out our intake survey: bit.ly/ucscTraining.

The other thing we have been able to do is launch a YouTube channel where you will find video tutorials explaining how to use various parts of the Browser. While static documents and email support are great, we realize some people learn better by seeing how something is done. We also hope this will be a good resource for those unable to physically attend one of our trainings. The video topics are meant to address some of the common workflows and questions we get from users. Each video is an illustration of how to answer a particular query, for example: “How do I identify exon numbers with the UCSC Genome Browser?

The answer will follow a sequence of steps traversing different parts of the Browser. For those who want to jump straight to one of the steps/skills listed in the video, you will find a set of internal links to the timepoints within the video in the YouTube video description. There, you will also find a transcript of the video if you want to follow along or take notes:

Screen Shot 2015-02-26 at 2.35.02 PM

You can find links to these resources on our training page. If you have a question that you’d like to see demoed in a video, we are always open to suggestions! You can reach the training department by email or tweet us an idea @GenomeBrowser.


If after reading this blog post you have any public questions, please email genome@soe.ucsc.edu. All messages sent to that address are archived on a publicly accessible forum. If your question includes sensitive data, you may send it instead to genome-www@soe.ucsc.edu.